Customer Success SaaS
This case study is about my humble contribution to the modern Customer Success Platform that puts your operational cadence in place. On this project, I was working on two parts: Health Management concept & UI, and the Stat Bar. The company is based in the UK, with team members located in the UK, Spain, Czechia, and Sri Lanka.
MY ROLE
Redesign, UX, User-testing, Prototype
THE TEAM
Designer
TIMELINE
August 2021 — 3 weeks
Method of Work
Design
Prototype

Handover
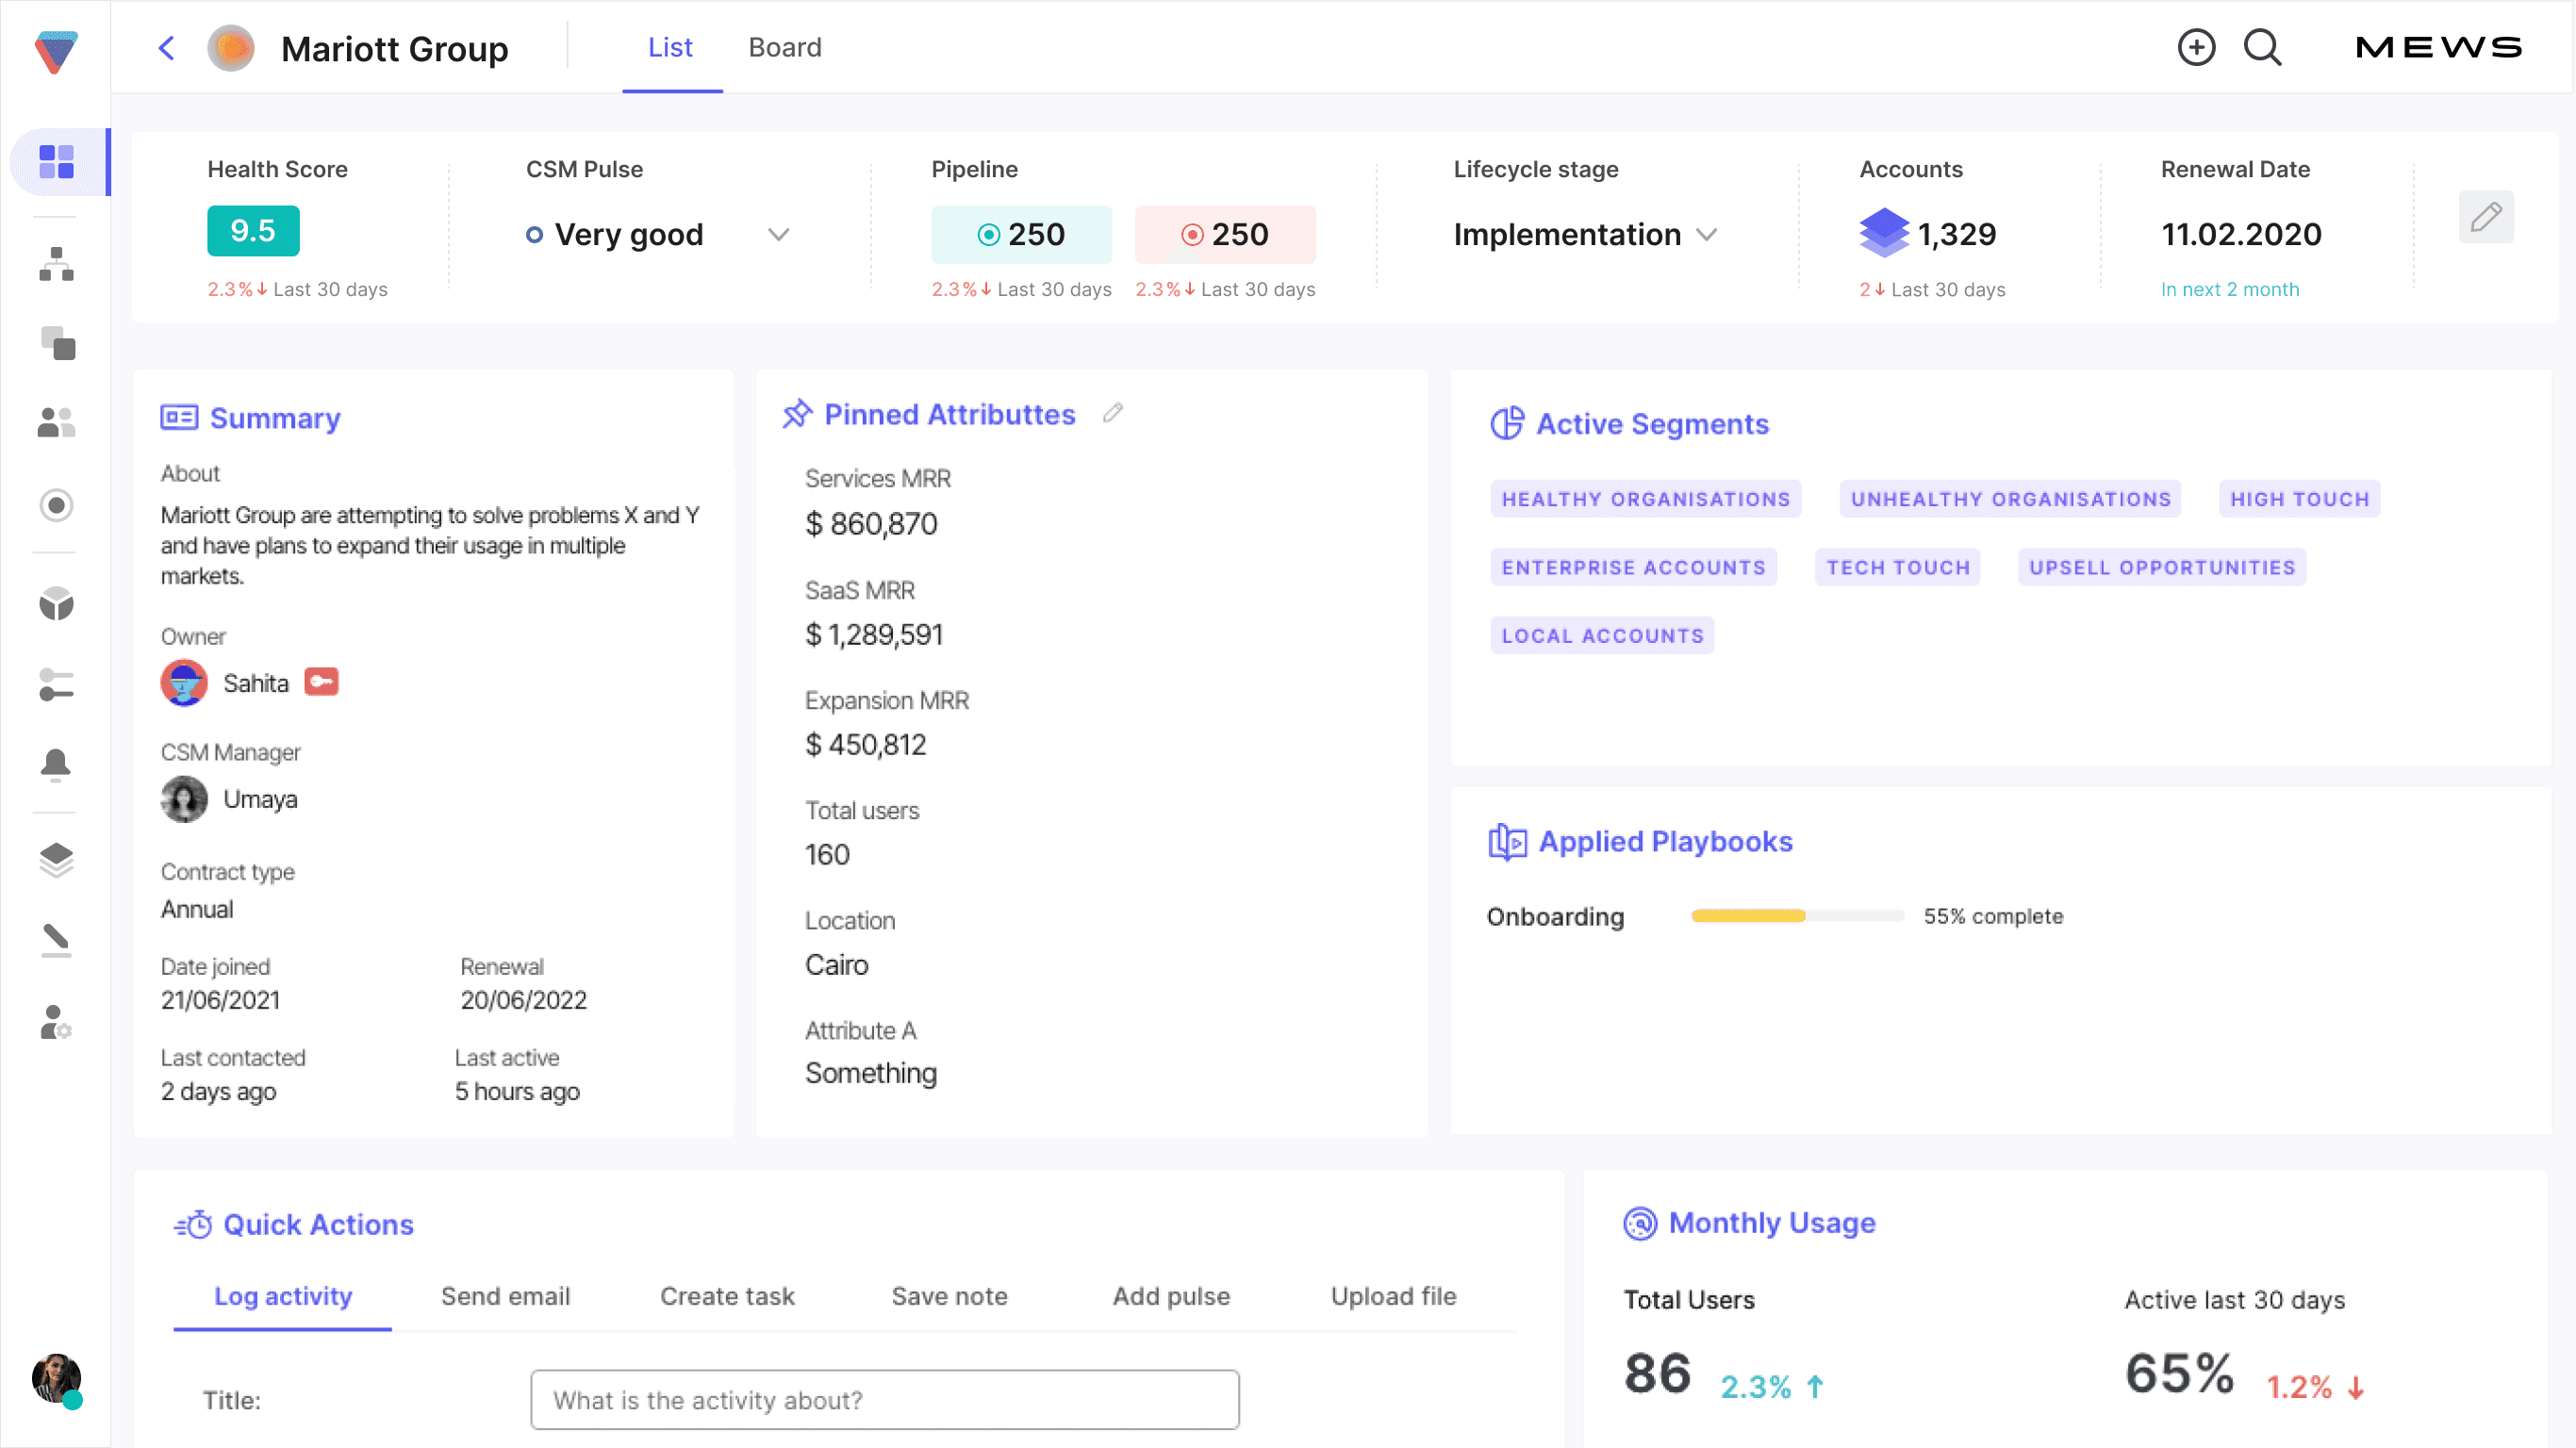
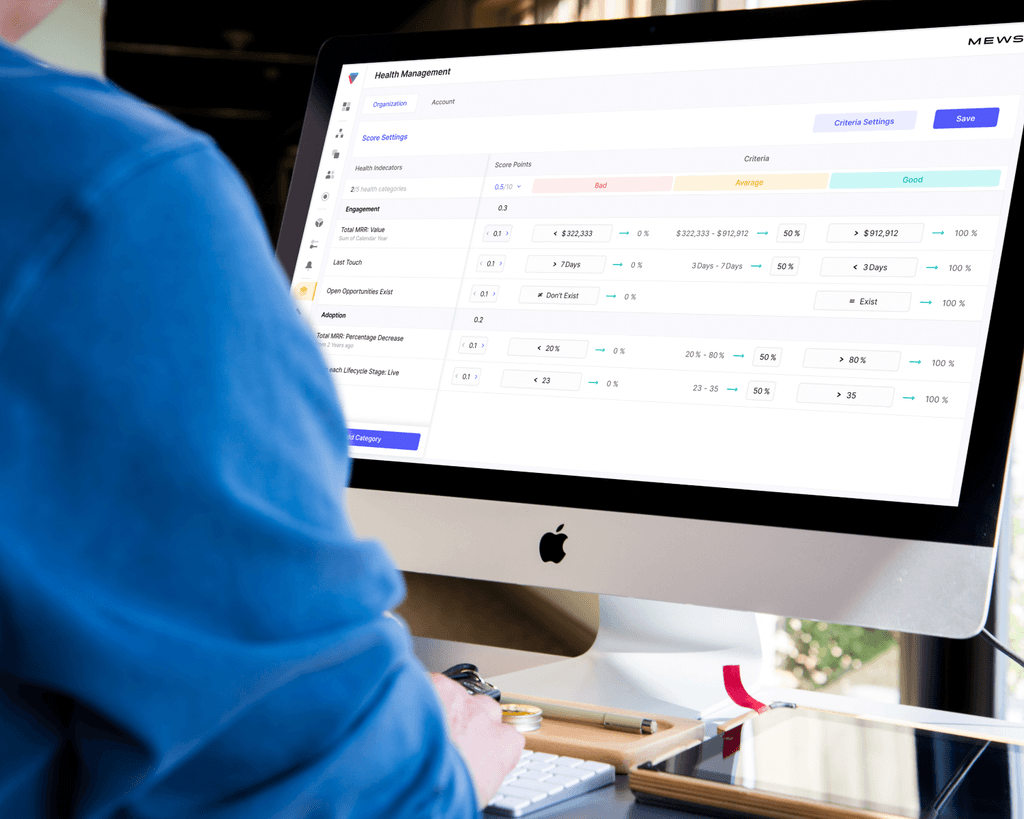
It was the most complex part, during which the users could set up the Health measurement for both organisations & accounts.
Grid
The grid is used as an overview of the customer health management. At the same time it is the place where the users can set up the Bad, Average & Good criterias for health indicators using the hybrid step by step inputs
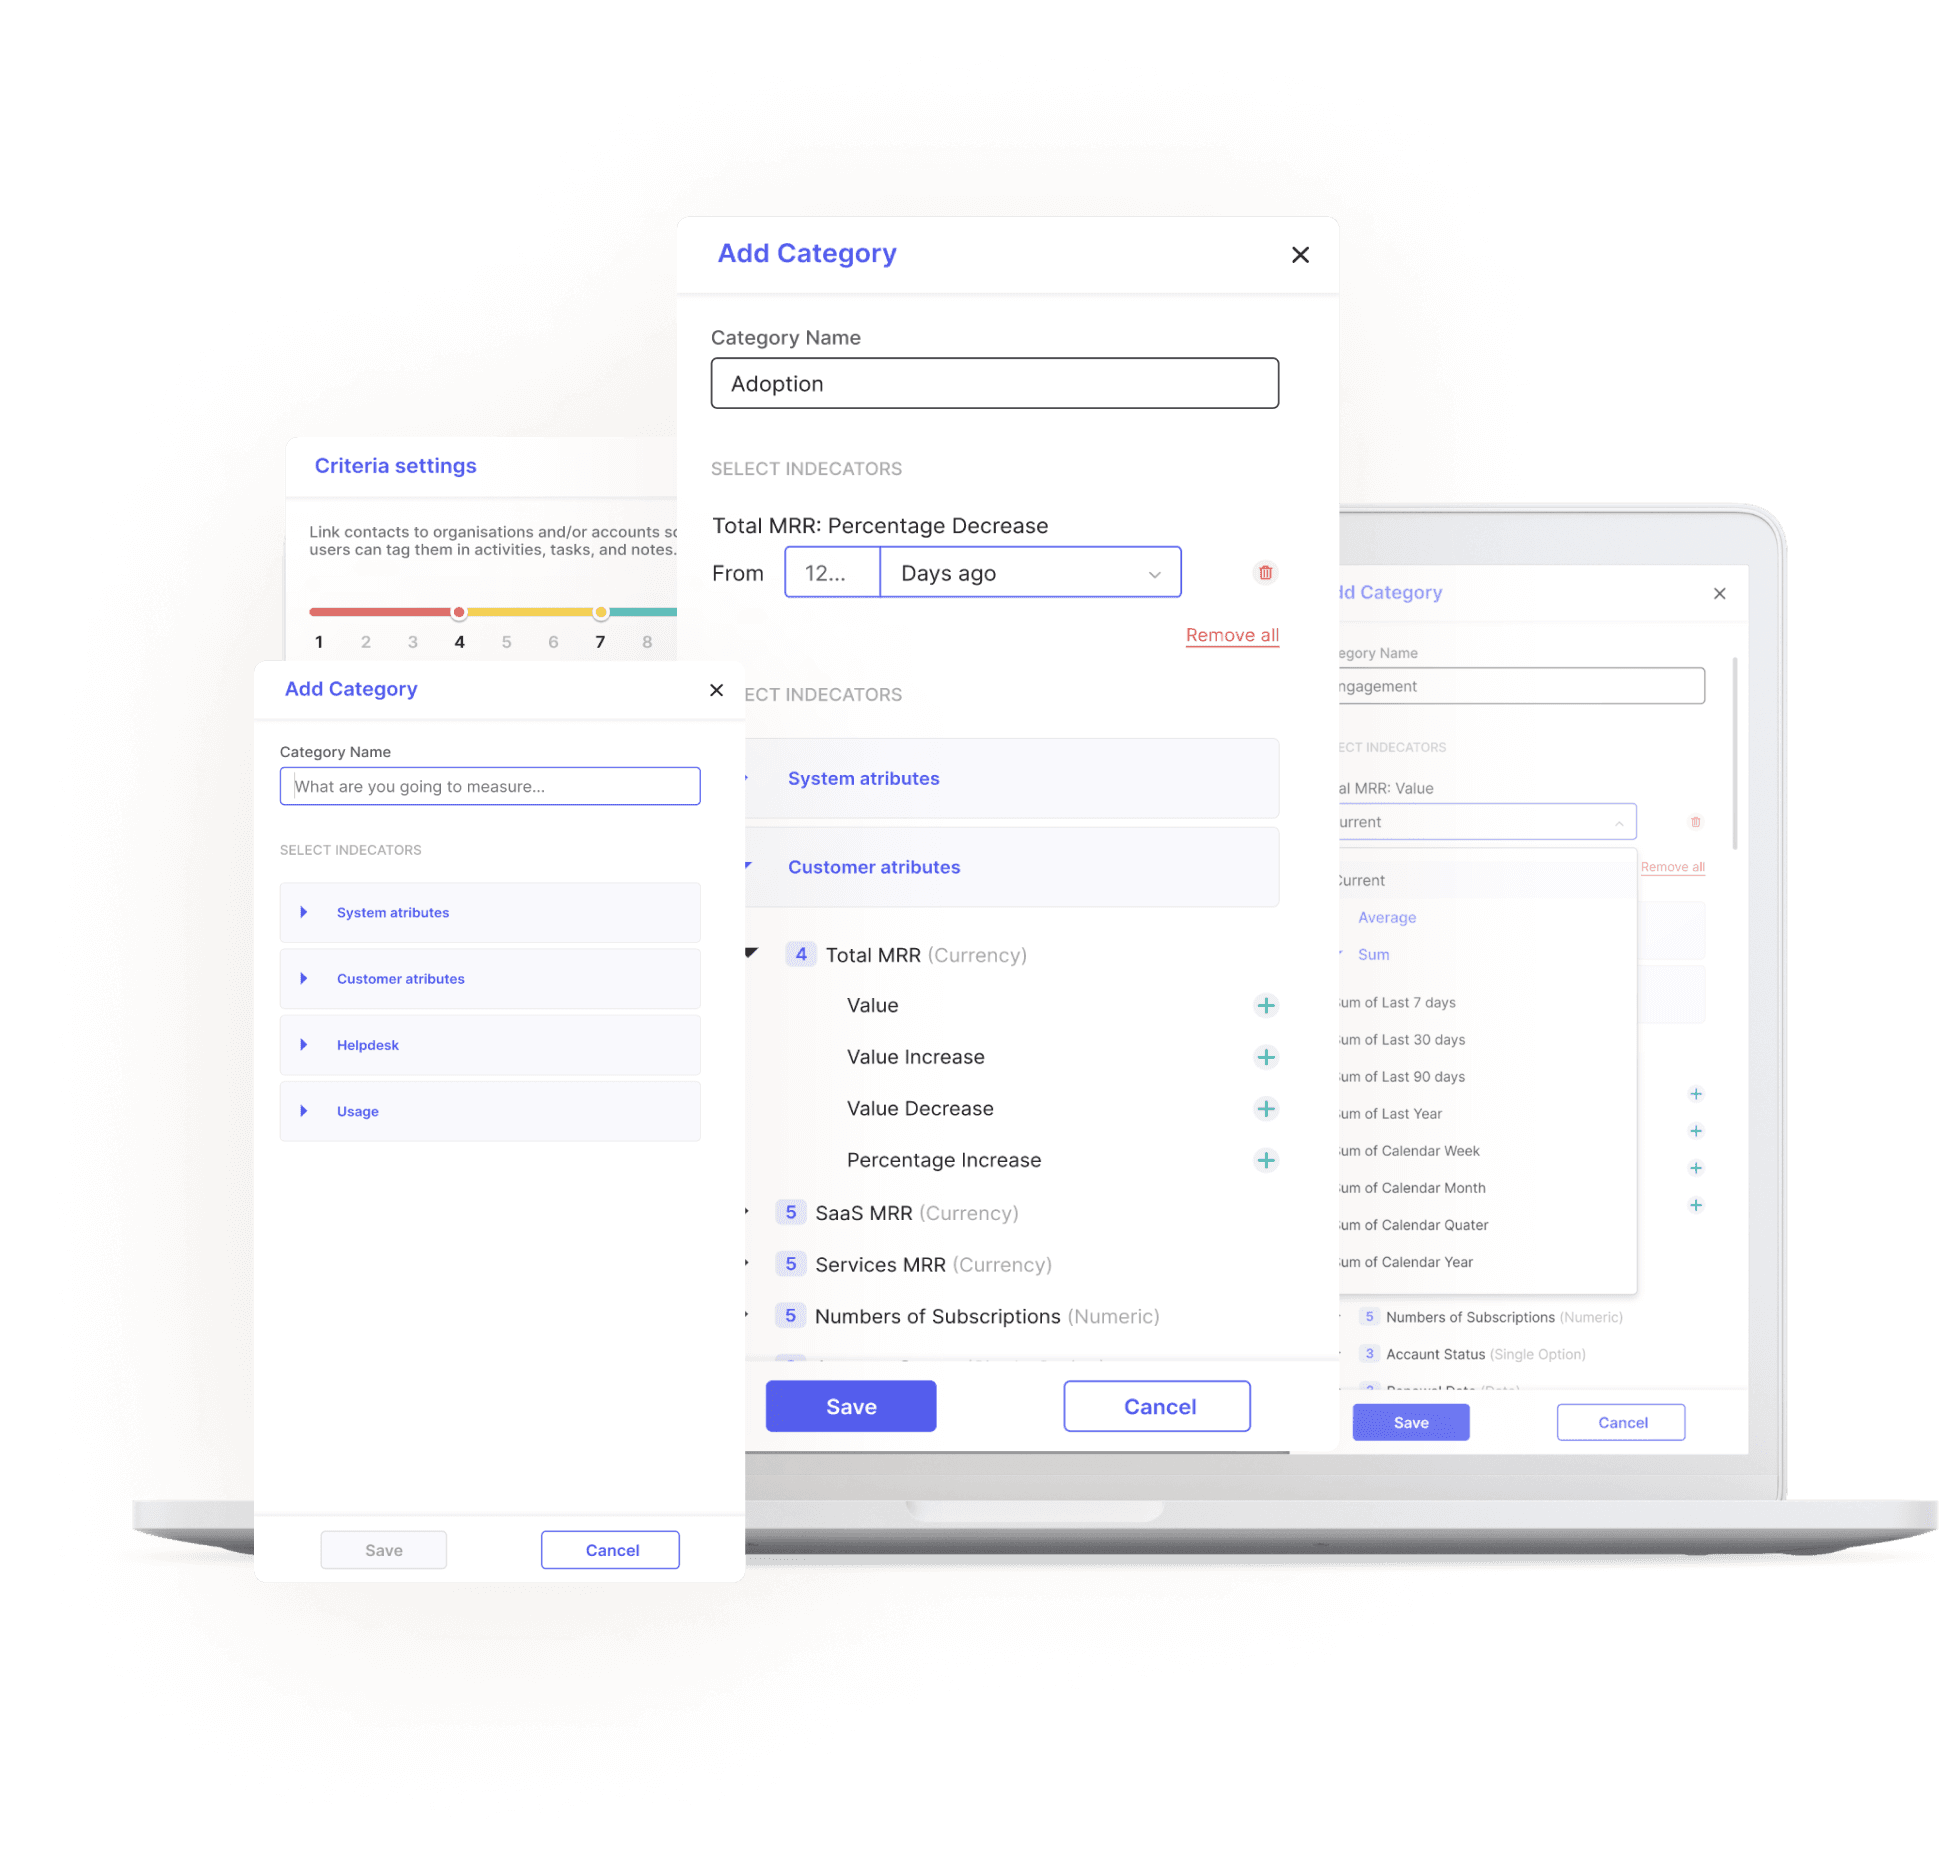
Side bar
Side bar is used to create the indicators, set up its aggregation, period, and then group the whole thing by categories. Different types of these indicators have different settings, and all of them are designed and prototyped. The side bar can be accessed from the grid.
RESULT
The whole flow is prototyped so we can play with id & validate our hypotheses. Heres goes the video
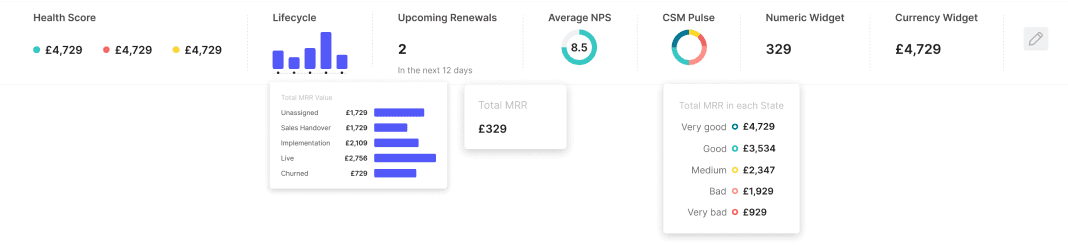
Chapter II: Stat Bar
Stat Bars can be set up for every major section in the system out of many available widgets. The users can have up to 7 widgets in it, using different settings & data aggregation. It’s pretty cool.

UX/UI Designer
Collaborated with a mentor-partner. Worked with teams to create mobile apps and web pages. Provided design materials and specifications, created design system participated in design discussions, and ensured workflow consistency.
Figma
Adobe XD
Sketch
Illustrator
PROJECTS:
The goal of this project was to create administration for the already existing Plasma Donation platform. During the journey, we created a style guide, added a few complex app sections, and partially redesigned the old ones. For mobile, tablet and desktop
The goal of this project was to create administration for the already existing Plasma Donation platform. During the journey, we created a style guide, added a few complex app sections, and partially redesigned the old ones. For mobile, tablet and desktop
We were working together on a few longer-term projects. And I wish we could do it again sometime. Very creative, cooperative, responsible, capable and sunny UI designer. Anastasiia is a good partner for every beginning.